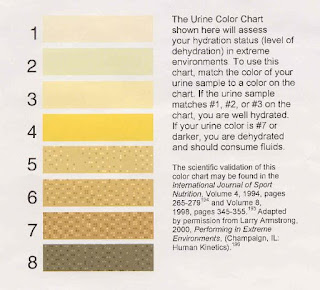
Yes, it is what it sounds. A chart about pee aka urine. Why on earth would anyone want to create, leave alone look at something like a 'Pee Chart' is what most of you are probably thinking.
Professional sportspersons not only look at it but also take it seriously, as their performance in their chosen sport depends on how hydrated they are. Optimum hydration (euhydration) means optimum performance in competitive or recreational sports, and dehydration spells disaster.
The Pee Chart is also called Urine Color Chart, and comprises of bands. Each band is numbered and is of a different color. And, each color corresponds to a particular stage in the transition between hydration and dehydration.
For instance, band numbers 1, 2 and 3 indicate optimum hydration. Bands 4, 5, 6 indicate a diminishing hydration status (you should consume fluids at this stage). And, band numbers 7 and 8 indicate a confirmed dehydration (errr...you should not have waited so long), calling for urgent corrective measures e.g. drinking water, juices, or an electrolyte based drink. Remember urine color gets affected few hours post-supplement intake.
This chart is not a hydration guide for only sportspersons. It can be used by just about anybody (you, yourself and yours) to learn to assess their hydration status. Heres to staying hydrated!
The Nutrition Omnibus and A Fistful of Nutrition © Raksha Changappa. Contents of this blog post (excluding images) are the exclusive copyright and intellectual property (IP) of Raksha Changappa. This post is solely for knowledge and information of the reader. If you want to use the post contents, kindly do so by acknowledging the source, namely this blog and the author, via hyperlinks or credits. If not, no content will be copied, reproduced, republished, transmitted or distributed, in any form or means, including print and electronic media. Copyright and IP infringements will be taken seriously. For queries contact nutrewise@yahoo.com
